Buffett Indicator app icon

A DeepValues app

Buffett Indicator

Is the US stock market cheap or expensive? Two valuation gauges answer it at a glance, every trading day.

On iPhone it is called Buffett Indicator, on Android Bubble Watch: the same app, with the same data.

iPhone: Buffett Indicator, a one-time paid download with no ads. Android: Bubble Watch, free with a small banner ad.

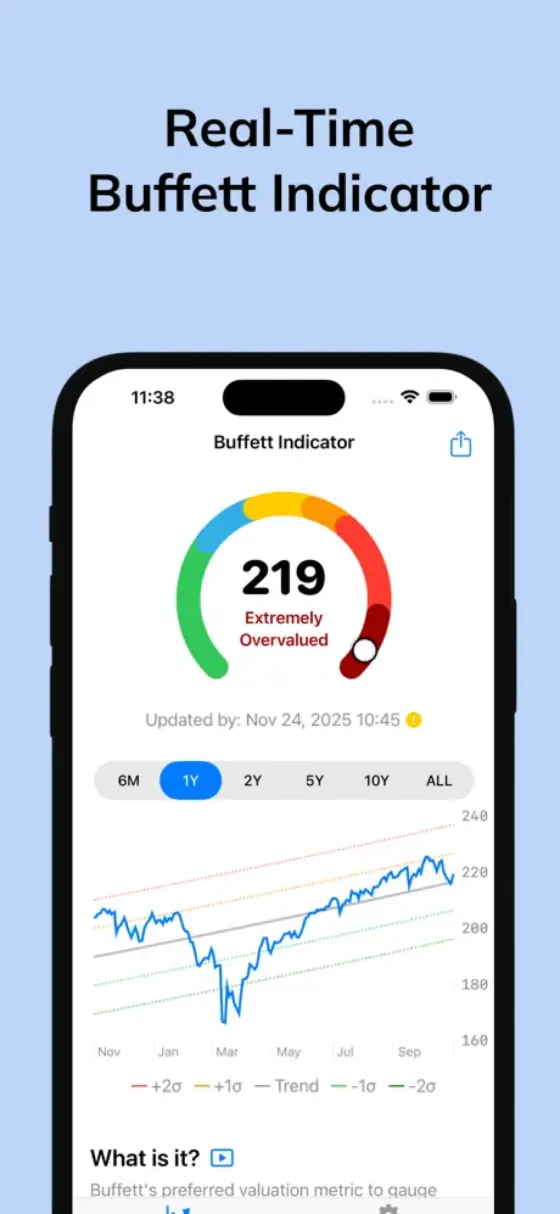
App Store screenshot: today's Buffett Indicator gauge with a one-year chart

Two gauges, in plain words

Both ask the same question from different sides: how much are investors paying for US stocks compared with what stands behind them?

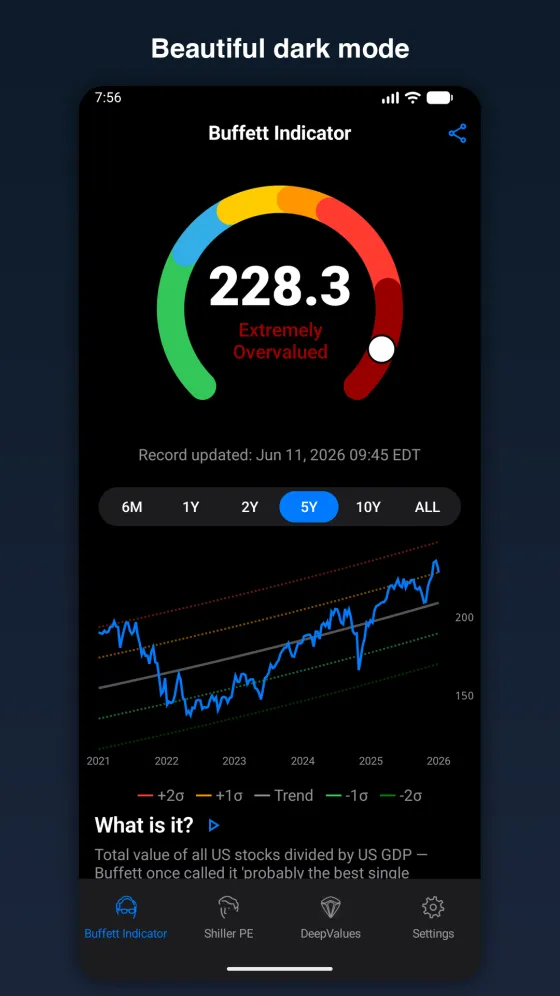
Buffett Indicator

Total US stock market value ÷ US GDP

It weighs the price of every listed US company against the size of the whole economy. Warren Buffett once called it “probably the best single measure of where valuations stand at any given moment.” Above 100%, stocks are worth more than everything the country produces in a year.

How the app reads it

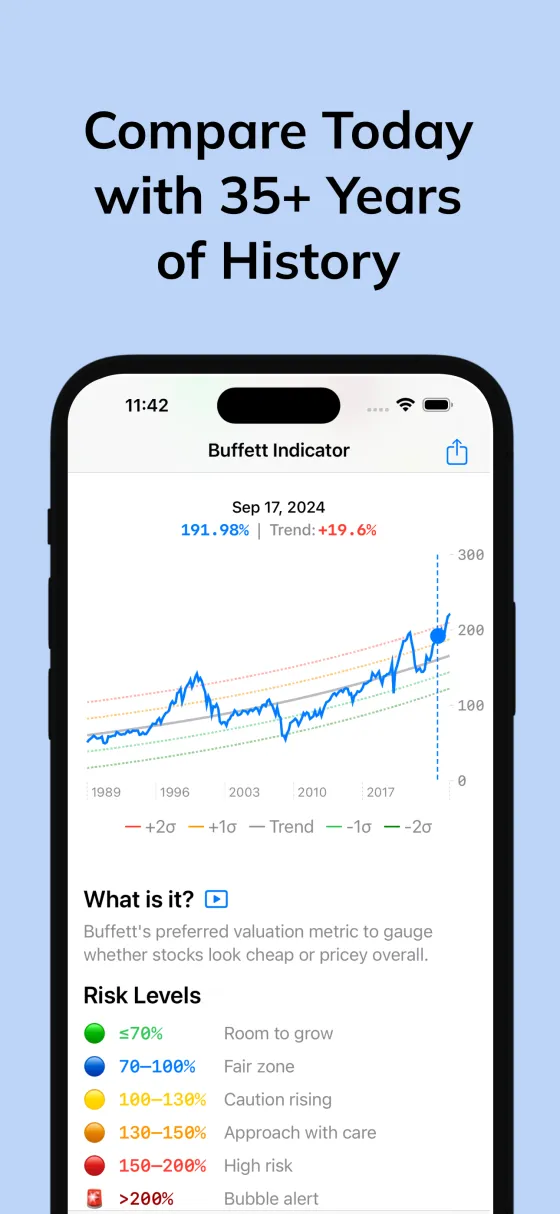
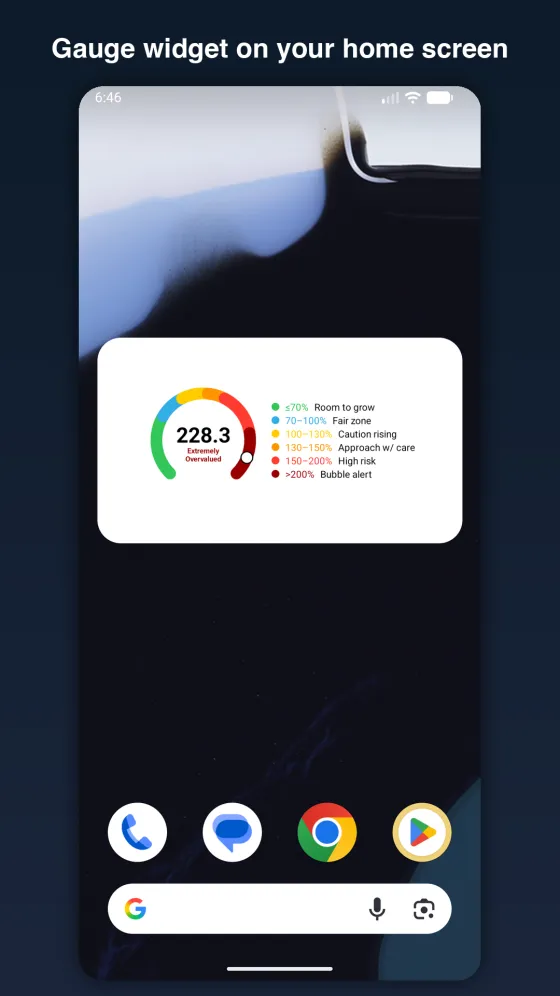
  • ≤ 70%Room to grow
  • 70–100%Fair zone
  • 100–130%Caution rising
  • 130–150%Approach with care
  • 150–200%High risk
  • > 200%Bubble alert

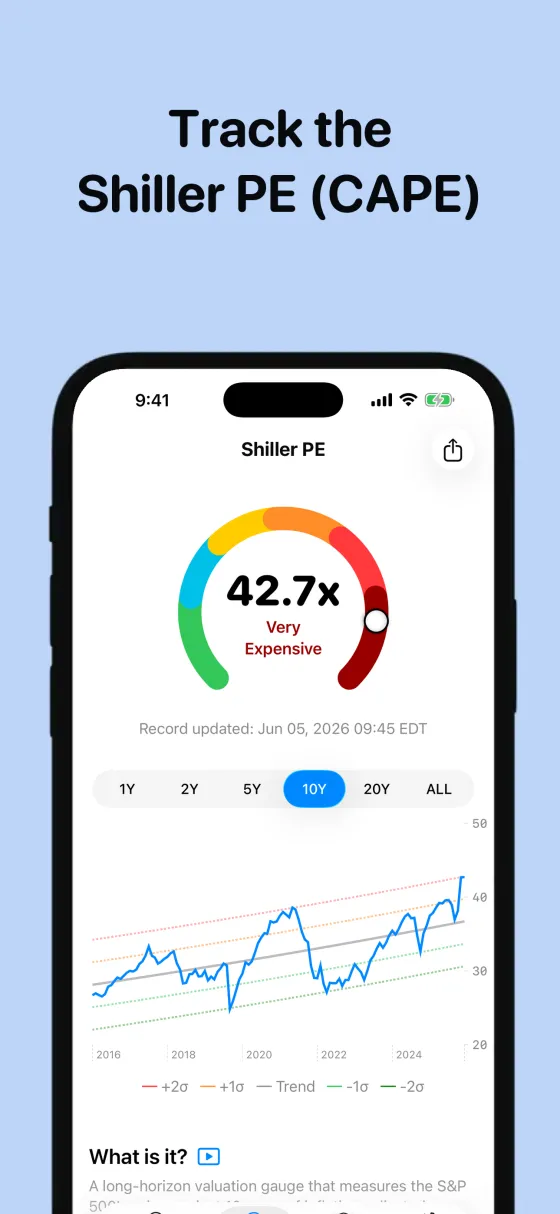
Shiller PE (CAPE)

S&P 500 price ÷ average inflation-adjusted earnings of the last 10 years

Averaging ten years of earnings smooths out booms and recessions, so the ratio shows what you pay for a typical decade of profits. It ran famously high before the 1929 crash, the dot-com bubble and 2008.

How the app reads it

  • < 10xCheap
  • 10–17xUndervalued
  • 17–24xFair value
  • 24–32xOvervalued
  • 32–40xExpensive
  • > 40xVery expensive

See it in the app

The screenshots from the App Store and Google Play listings.

What's inside

Two live gauges

The Buffett Indicator and the Shiller PE, refreshed every US trading day, with color zones from undervalued to bubble.

Decades of history

Charts from six months to the full record: 35+ years of the Buffett Indicator and 140+ years of the Shiller PE, with a trend line and ±1σ / ±2σ bands.

Home-screen widget

Today's gauge on your home screen, without opening the app, on iPhone and Android.

Daily or weekly alerts

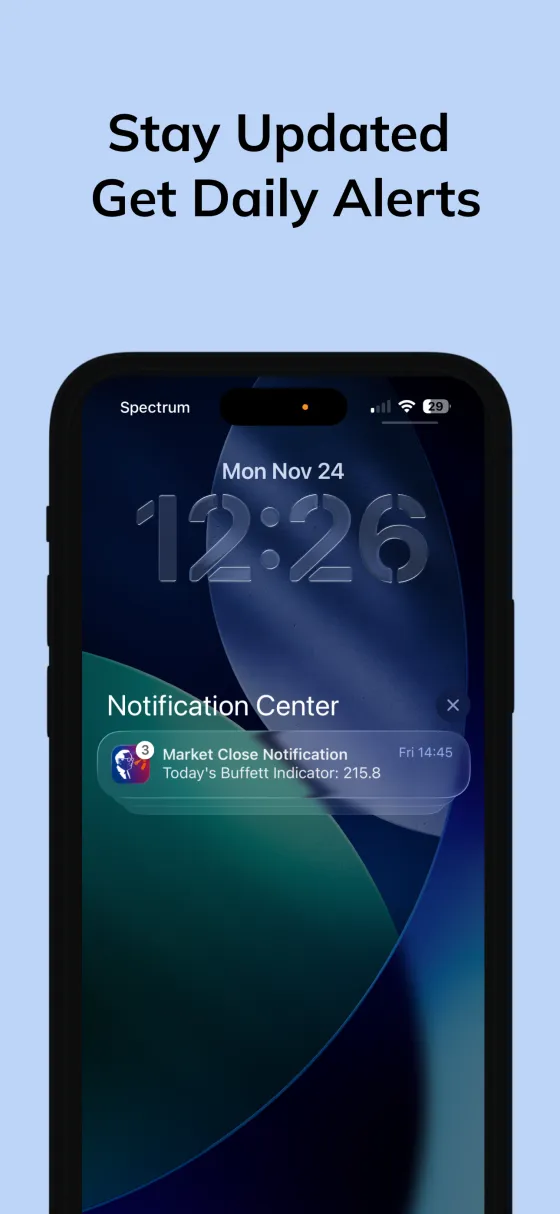
A notification each trading day after the US market closes, or once a week if you prefer.

The math, explained

Tap “What is it?” to see the formula worked through with today's numbers, plus a short explainer video.

Share the gauge

Send today's reading as an image to a friend or a group chat.

Dark mode, 13 languages

English, Simplified and Traditional Chinese, Japanese, Korean, French, German, Italian, Spanish (Spain and Latin America), Brazilian Portuguese, Hindi and Indonesian.

DeepValues inside

A DeepValues tab opens DeepValues' value-investing research, for when you want to go from the whole market to single companies.

Frequently asked questions

What is the Buffett Indicator?

The total market value of all US stocks divided by US gross domestic product (GDP). It shows how richly the stock market is priced against the economy that earns its profits. The app uses the Wilshire 5000 for market value and official US GDP data.

What is the Shiller PE (CAPE)?

The S&P 500's price divided by its average inflation-adjusted earnings over the previous ten years, a measure popularized by economist Robert Shiller. Its monthly history goes back to the 1880s.

How often does it update?

Both readings refresh once every US trading day. With alerts on, you get a notification when fresh data lands, daily or weekly as you choose.

Is it free?

Bubble Watch on Android is free to download and shows a small banner ad. Buffett Indicator on iPhone is a one-time paid download with no ads and no subscription; the App Store shows the price in your country.

Which phones does it run on?

iPhone with iOS 17 or later, where the app is called Buffett Indicator, and Android 8.0 or later, where it is called Bubble Watch. Both read the same data.

Is this investment advice?

No. The app shows public market data for information and education only. It is not investment advice, and it is not affiliated with Warren Buffett or Berkshire Hathaway.

More from DeepValues

The DeepValues app

Stock research for value investors: what a company is worth by three valuation models, what 93 tracked investors bought and sold, and AI research briefings that show their work.

Explore DeepValues →

Margin of Safety Weekly

One email every Saturday: what the great investors did, where the market stands, and the week’s research, in plain language.

Get the free weekly email →